For the last 6 months or so I’ve been working on a debugger for hxcpp programs which uses a sourcemaps approach, this post is going to be an overview of the why, what, and how of that.
Isn’t there already a debugger?
There is, and to give a bit more context into what makes mine different I’m going to go into a bit of detail into how the current one works. With hxcpp-debugger (the existing debugger) your program essentially debugs itself. If you’ve ever looked at the c++ haxe generates you’ve probably seen lots of “HXLINE calls placed around. These are c++ macros which in a non-debug build expand to nothing, but when compiling with debugger support, they expand to the following.
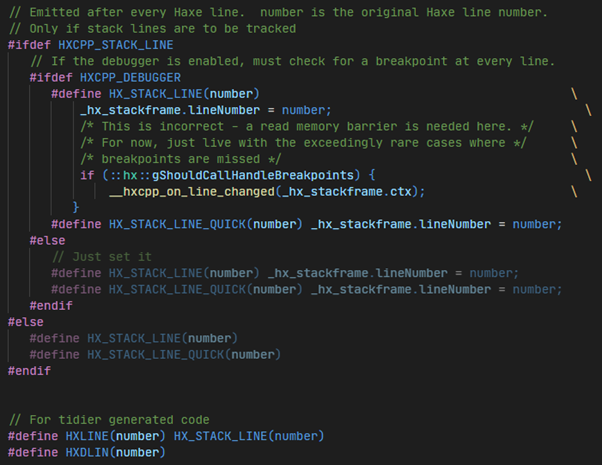
As you can see these macros expand to generate code which checks for breakpoints at the beginning of the c++ code which maps back to a haxe line. “HX_VAR” is another macro function which, with debugging support, expands to code which generates stack objects for inspecting haxe variables and changing their values.
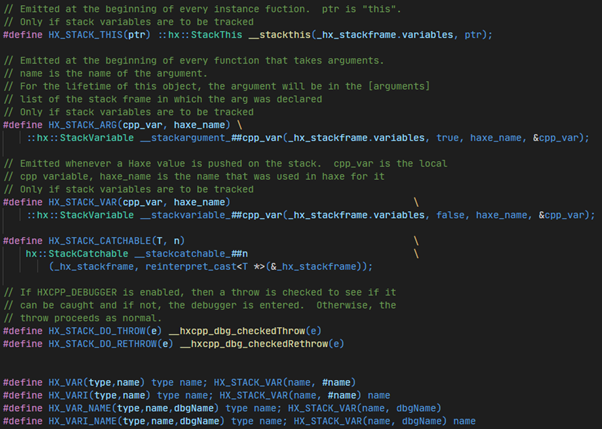
There are many other macros which expand to other code for tracking information relevant to the haxe code you originally wrote. A separate thread then runs in the background which has a TCP socket for receiving requests for information and sending responses about the state of the program.
One final part I’m going to cover is null pointers since this will come up again later. Heap allocated objects are stored as pointers in a stack allocated “hx::ObjectPtr” class in the generated C++, this class overrides the “->” pointer access operator and performs a check for a null pointer.
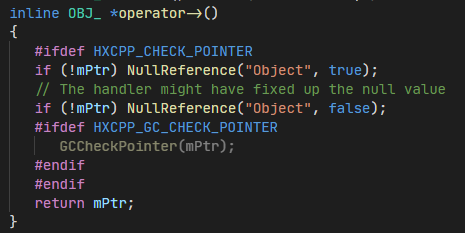
The “NullReference” function contains a bunch of code for pausing haxe threads and reporting the null pointer error through the debugging thread.
Whats the problem with it?
The program debugging itself does work in many cases and is very portable, if you want to port hxcpp to a new platform all you need to do is implement the sockets and you can start debugging. But, as you’ve seen, this relies on the compiler generating these macro calls which expand into the scaffolding code. In the case where such code does not exist any errors will not be caught and the program (and debugger since they’re the same) will crash with no hint of what happened.
This is not just some theoretical issue, currently the generated code for interfaces does not have the null pointer checking which classes do, this means if you call a function on a null interface, it will not be caught by haxe-debugger and your program will just crash with a segmentation fault.
The other situation this occurs in a lot is native code and interop, most of the types in the “cpp” package are not safe. Types such as “cpp.RawPointer” and “cpp.Star” represent native pointers and do not have the checks generated, if you call an extern function which returns a null pointer and you forget to check it, then you’re going to get an un-debugable crash.
C++ debugging
Externs allow you to call native c++ code from your haxe program, but most of the time you will be wrapping those calls in glue code to transform it into haxe friendly data structures instead of just exposing raw pointers, c arrays, etc, to your haxe code. This glue code could either be in haxe by using the helper types and functions in the “cpp” package, or in C++ where you could write wrapper functions to generate haxe arrays, enums, anonymous objects, and whatever else you might want in C++. In both these cases hxcpp-debugger doesn’t give you the tools you want. Non haxe types aren’t inspectable and any C++ glue code also can’t be debugged. Pausing your program only pauses the haxe threads, native C++ threads are free to continue running which means they’re also not inspectable.
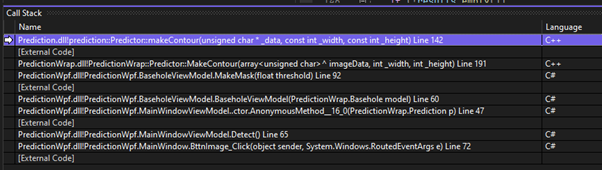
This means when it comes to debugging interop code a native C++ debugger like visual studio needs to be used. This does work well, but its not a great experience. The C++ generated by the haxe compiler isn’t the most human readable, eventually you get an understanding of why its generated the way it is, but it’s never the simplest to understand. Most of the hxcpp types and data structures aren’t natively understood by the debuggers so you get no visualisations. I.e hovering over a hxcpp array type in visual studio doesn’t give you a nice list of the contents. Instead, you get this.
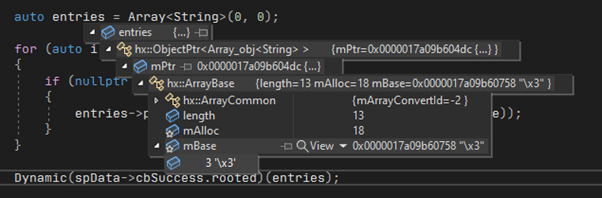
You can write your own visualisations, but this isn’t easy as it requires in depth knowledge of hxcpp internals and each c++ debugger has its own method of writing visualisations.
Mixed mode debugging
The issue of having two languages and needing to switch between debuggers as and when isn’t a situation unique to haxe. Most languages have FFIs and usually you’d need to choose between debugging one language or the other, but some ecosystems have solved this issue.
Visual Studio has a featured called mixed mode debugging which allows you to debug C# and C++ in the same debug session, you can step into a C# function which calls C++ and then everything seamlessly switches over to C++ debugging. The call stack shows C# and C++ functions, you can inspect both C# and C++ types, etc, etc.
Not having to constantly switch between a C# and a C++ debugger massively speeds up development time and makes debugging interop between the two languages very easy.
Could we have something similar?
I realised that the javascript debugging approach could work in this situation. Haxe and many other languages can compile to javascript and will generate a sourcemap.json file which the javascript debugger reads and uses to map the compiler generated javascript back onto the source language. Could the haxe compilers C++ generator be updated to emit a similar sourcemap file and a debugger be created which uses a C++ debugger under the hood?
Hxcppdbg
Yes! This is what I’ve been working on, and while it’s still early on it shows that the idea is sound. Under the hood a C++ debugger is being used to debug the hxcpp program but by using a sourcemap generated by haxe c++ line numbers can be mapped back onto haxe lines, functions are un-mangled and mapped back to haxe functions, all haxe classes and hxcpp structures are visualised in ways which make sense and hides runtime implementation details, and I’ve started on some of the mixed mode functionality.
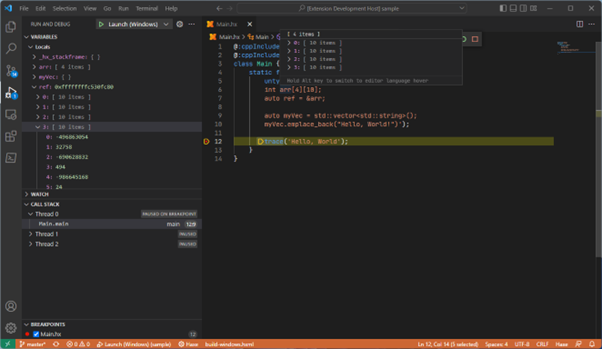
Untyped C++ can be debugged just fine, extern classes can also be inspected, and all C++ types and data can be inspected, even if you don’t fill out your extern class definition the fields will still appear.
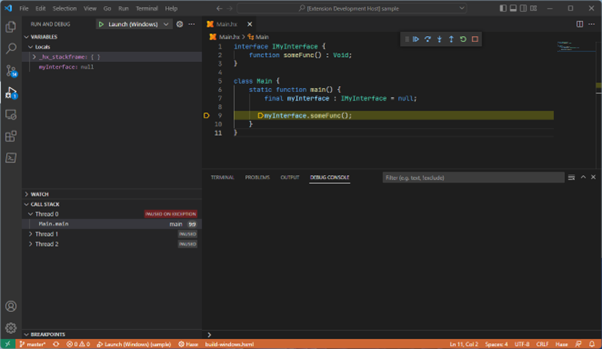
Since a C++ debugger is being used, we get an inspectable program on native null pointer access. This means null interfaces can now be debugged and interop code is also inspectable when C++ errors occur!
Internals
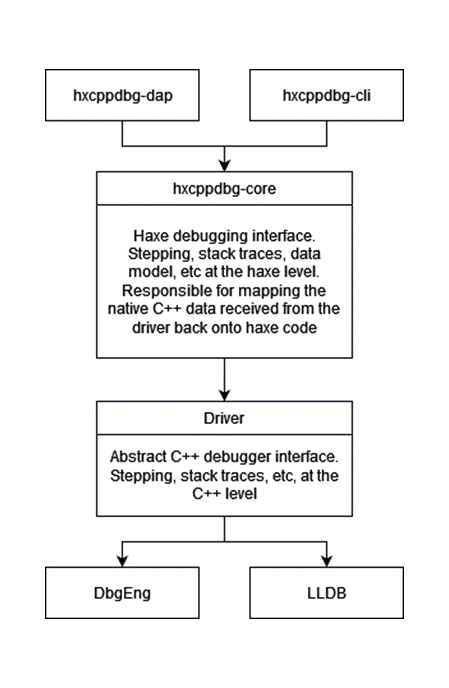
There are two main ways of interacting with hxcppdbg, the first is a basic command line interface which is mainly used for easier debugging, the second and main way is as a DAP (debug adapter protocol) server for IDE integrations. Both frontends use the hxcppdbg-core haxe library which provides an interface for debugging and inspecting a hxcpp program. Hxcppdbg-core contains a driver interface for the native debugger which allows multiple C++ debuggers to be used as a backend (DbgEng on Windows, LLDB elsewhere). When hxcppdbg-core is asked for the stack trace it will fetch the native stack trace from the driver and then map it back onto haxe code. When hxcppdbg-core is asked to step over a line it will potentially issue multiple native step overs to the driver based on information in the sourcemap.
File and line mapping
The sourcemap contains a record of every type and the haxe file its defined in, it also stores the location of generated .h and .cpp files for that type. A mapping between the line numbers in the generated c++ files and the line position of the corresponding haxe expression is also stored. This information allows us to place breakpoints in the native c++ code at a given haxe line. It also allows us to map c++ files and line numbers back to the original haxe files.
Name mapping and mangling
The c++ generator of the haxe compiler has a list of reserved names which variables are checked against and renamed if needed. The sourcemap keeps track of any renamed variables so they can be displayed as the user originally wrote them in the debugger.
Stepping
Stepping currently operates on a naïve algorithm, for a given step type continue performing native steps of that type until the c++ line maps onto a different haxe line than we started with. This works but, in many cases, can be slow. In the future I want to enhance the source map to contain an AST dump instead of a flat haxe to c++ line mapping so we can be smarter about this stepping algorithm.
Data Model
The targets memory is converted into the data model enum tree for easy traversal. This tree is lazy loaded, and the results cached, so target memory is only ever accessed once and is accessed on demand, so large arrays, maps, or other structures are not a problem.
enum ModelData
{
    MNull;
    MInt(i : Int);
    MFloat(f : Float);
    MBool(b : Bool);
    MString(s : String);
    MArray(model : Indexable<ModelData>);
    MMap(type : Keyable<ModelData, KeyValuePair>);
    MEnum(type : GeneratedType, constructor : String, arguments : Indexable<ModelData>);
    MAnon(model : Keyable<String, NamedModelData>);
    MClass(type : GeneratedType, model : Keyable<String, NamedModelData>);
    MNative(native : NativeData);
}

enum NativeData
{
    NPointer(address : Int64, dereferenced : ModelData);
    NType(type : String, model : Keyable<String, NamedModelData>);
    NArray(type : String, model : Indexable<ModelData>);
    NUnknown(type : String);
}
Non haxe types are placed into the native enum, this allows us to view native pointers, arrays, structs, classes, etc alongside the haxe types.
Running evaluations against this tree is then very simple, hscript is used to parse expressions and a custom interpreter used to run the hscript AST against the data model.
Planned
There is still much to do both big and small, below is a handful of the larger features I want to implement down the line.
- I want to work on further mixed mode debugging features. Ideally you should be able to step into an extern function from haxe and then start debugging c++.
- I want to make further improvements to the expression evaluator, allowing custom functions to be defined for later re-use.
- Other breakpoint types still need to be implemented (conditional, function, and log points).
- The LLDB driver needs some love. LLDB’s API is very lacking compared to the DbgEng and DbgModel libraries on Windows. This means that the entirety of the data model is un-implemented with LLDB. Adding support for this is proving to be a massive pain and as I don’t actively need non-windows support right now it’s been on the back burner for a while.
- The data model is currently read only, ideally you would be able to change values while the target it paused. This should be quite simple for ints, floats, and bools, but anything more becomes tricky as even strings use GC memory.
Hxcppdbg is not currently ready for use as it requires both a custom haxe fork and a custom hxcpp fork, the DAP server for IDE integration is also not packaged up in an easy to consume way. In time I hope to sort this out so its easier to try out, but in the mean time you can track progress on the github repo, or if you’re on the haxe discord channel in the hxcppdbg project post.